
We have previously discussed technologies that can be used for the remote sensing of methane emissions. In this article we focus on the Bowen region of Queensland. We review some of our ongoing R&D activities, and highlight promising areas for future development.
1. Detection and quantification of single methane plumes in TROPOMI
Large methane emissions from point sources, such as coal mines, may be clearly visible in daily TROPOMI products, if not occluded by cloud. In this case, they can be identified by inspection, and quantified using a method such as the cross-sectional flux (CSF), as reported by Sadavarte et al. [1].
In the CSF method, we draw transects across a methane plume, along the major axis of the wind vector. Flux can be calculated, based on the assumption of a 2D plume, using a modified formula for volumetric flow rate, that is, flow velocity times cross-sectional area.
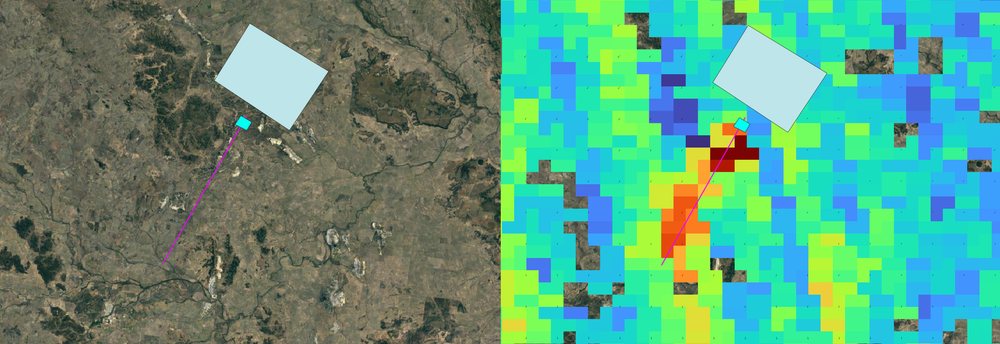
We have repeated, and independently verified, the flux values published by Sadavarte et al. for methane emissions from super emitting coal mines over the Bowen region [1].
In TROPOMI products, methane plumes often have characteristic shapes. Specifically, we are looking for a high methane level above the point source, with a plume that extends away from the source along the direction of prevailing wind at the time of sensing, and then declines in strength along its axis.
AI screening
One of the limiting factors with regard to plume detection is the need for visual inspection of TROPOMI products. However, the detection of TROPOMI plumes is a task well suited to machine learning. This opens up the possibility of both persistent monitoring of single sites, and ongoing global monitoring for new emissions.
Since our last article on TROPOMI, Schuit et al. [2] have published their approach. They used a two-stage method: a Convolutional Neural Network (CNN) was used to detect plume-like structures in TROPOMI CH4 data, and a Support Vector Classifier (SVC) was then used to screen for artefacts amongst the potential plumes. The SVC incorporated additional information, such as wind vectors. Quantification can also be automated, using the Integrated Mass Enhancement (IME) method, whereby the emission rate is calculated from the observed methane enhancement in the plume, and the local wind [3].
AI screening of TROPOMI CH4 has considerable scope for further innovation, and this is an active area of interest for us. Some areas of active development include the use of richer imaging and hybrid datasets, and the incorporation of supplementary data at the CNN stage. We suggest that this is preferred over the use of a two-stage model, because it enables the CNN to develop more nuanced feature maps. In addition to wind vectors, supplementary data might include a prior based on site-specific emission characteristics, something that was excluded from the cited study.
2. Detection of methane emissions using wind-rotated TROPOMI
Some of the challenges of using TROPOMI CH4 data are its relatively low spatial resolution (7 x 5.5 km), and its reliance on cloud free observations. TROPOMI data is often sparse. It is not uncommon for known plumes to be extremely difficult to detect within a single TROPOMI product, due to data sparsity or cloud occlusions.
However, as we have previously discussed, the wind rotation processing technique can enhance TROPOMI data, and allow point sources to be localised with more confidence [4]. These wind-rotated methane plumes are mean emissions, compiled over some period, months to years. Mean methane emission rates can still be calculated, based on the IME method discussed above [3, 4].
Although originally reported for periods of 12 months or more [4], where TROPOMI data is sufficiently rich the technique can be applied to monthly TROPOMI data.
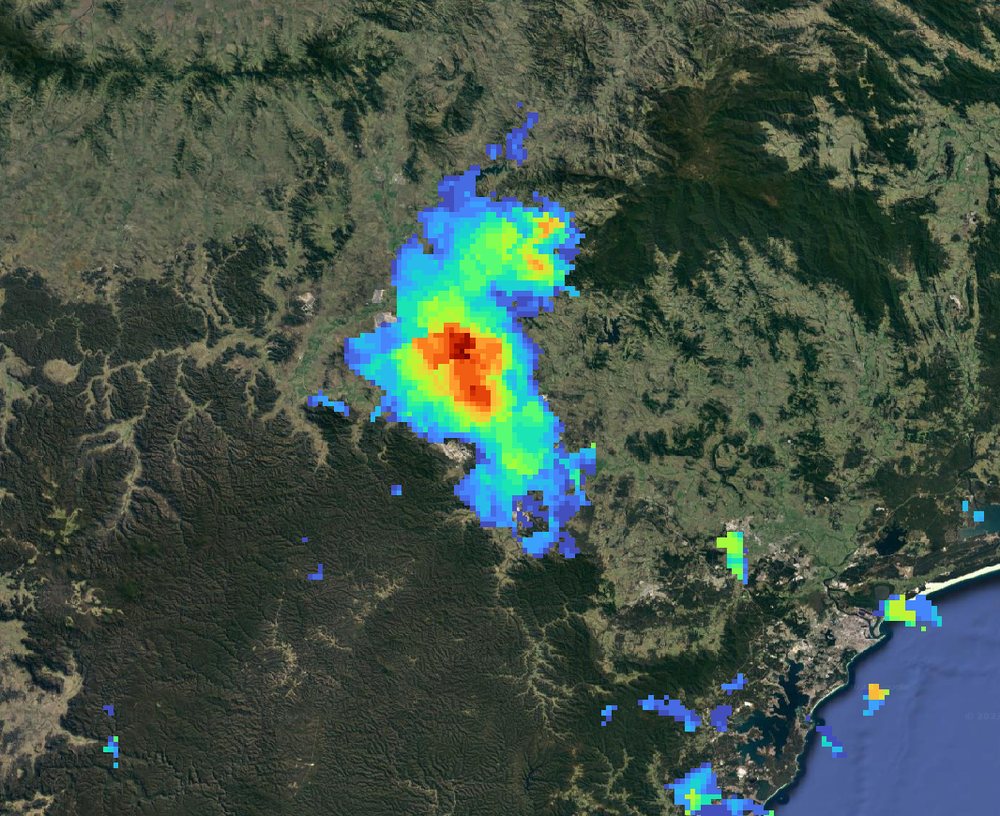
With the requisite domain knowledge, both spatial (mine structure) and temporal (mine activity), we can attempt to interpret the cause of the observed emission.
References
- Sadavarte, P., Pandey, S., Maasakkers, J.D., Lorente, A., Borsdorff, T., Denier van der Gon, H., Houweling, S. and Aben, I., 2021. Methane emissions from superemitting coal mines in Australia quantified using TROPOMI satellite observations. Environmental Science & Technology, 55(24), pp.16573-16580.
- Schuit, B.J., Maasakkers, J.D., Bijl, P., Mahapatra, G., Van den Berg, A.W., Pandey, S., Lorente, A., Borsdorff, T., Houweling, S., Varon, D.J. and McKeever, J., 2023. Automated detection and monitoring of methane super-emitters using satellite data. Atmospheric Chemistry and Physics Discussions, pp.1-47.
- Varon, D.J., Jacob, D.J., McKeever, J., Jervis, D., Durak, B.O., Xia, Y. and Huang, Y., 2018. Quantifying methane point sources from fine-scale satellite observations of atmospheric methane plumes. Atmospheric Measurement Techniques, 11(10), pp.5673-5686.
- Maasakkers, J.D., Varon, D.J., Elfarsdóttir, A., McKeever, J., Jervis, D., Mahapatra, G., Pandey, S., Lorente, A., Borsdorff, T., Foorthuis, L.R. and Schuit, B.J., 2022. Using satellites to uncover large methane emissions from landfills. Science Advances, 8(31), p.eabn9683.
- Ember, Abandoned Mine Methane. https://ember-climate.org/insights/research/tackling-australias-coal-mine-methane-problem/
- Sherwin, E.D., Rutherford, J.S., Chen, Y., Aminfard, S., Kort, E.A., Jackson, R.B. and Brandt, A.R., 2023. Single-blind validation of space-based point-source detection and quantification of onshore methane emissions. Scientific Reports, 13(1), p.3836.